Viewing Graphs and Utilization of Linux Instances
Graphs and Utilisation for Linux instances helps monitor real-time performance and analyse resource usage. It provides insights into key metrics like CPU, memory, network, and disk activity, enabling better monitoring and troubleshooting.
Graphs (Real-time)
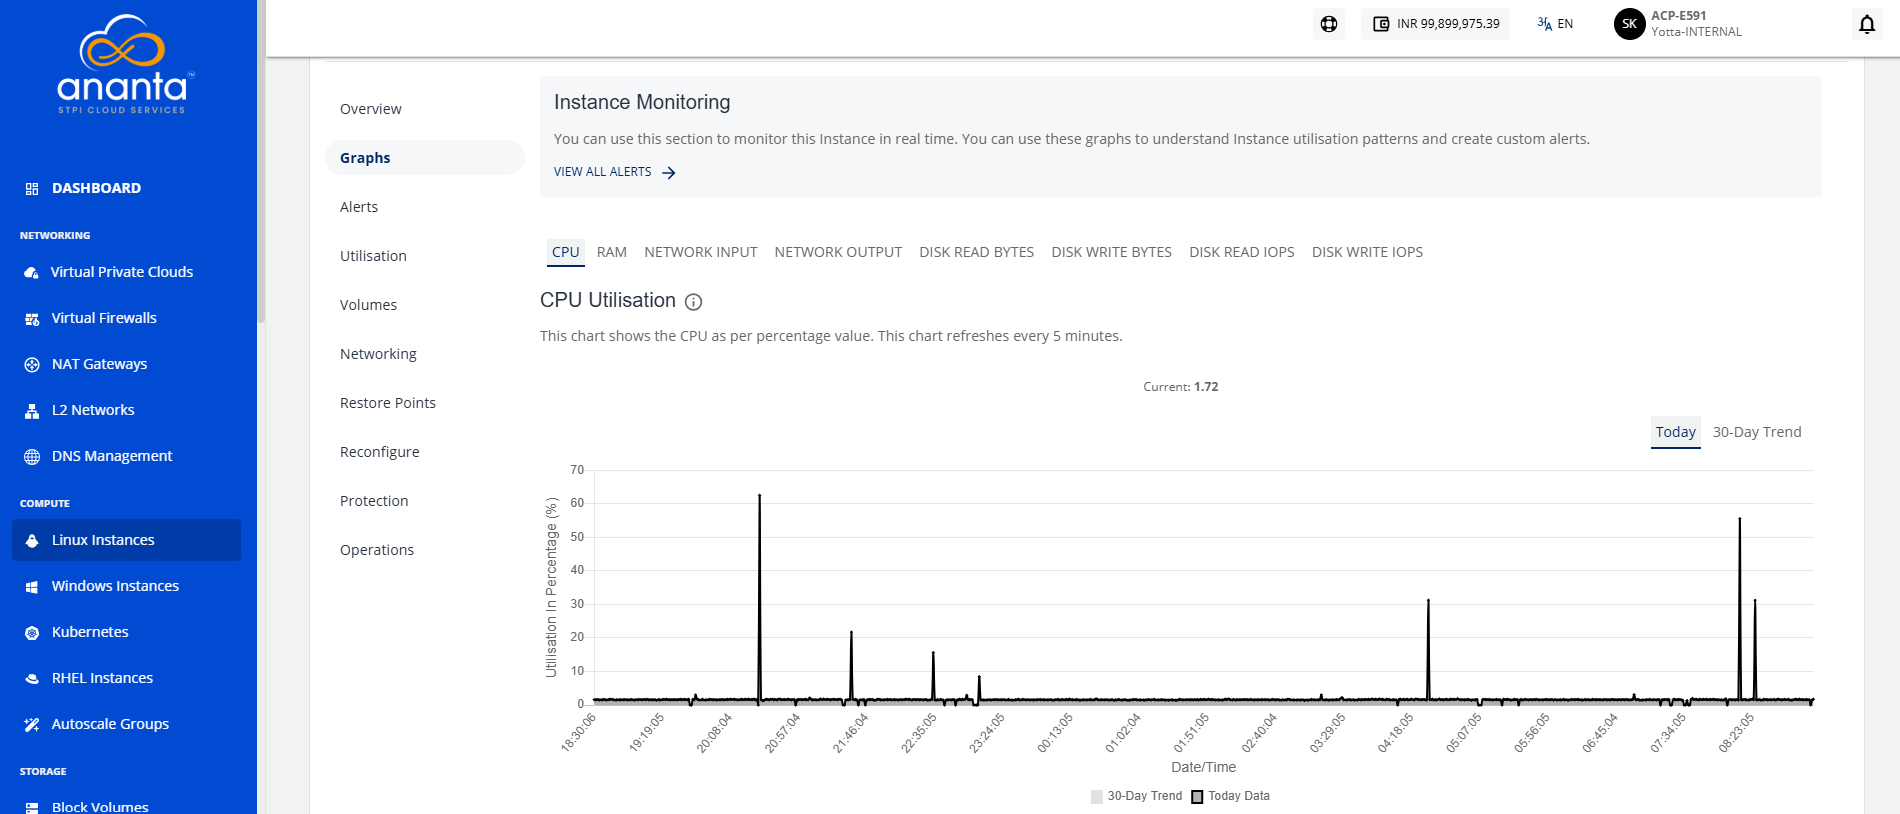
To view the available graphs and monitor the instance in real time, navigate to Compute > Linux instance, select Linux Instance, and access the Graphs tab.
You can use these graphs to understand Instance utilisation patterns and create custom alerts.
The graphs are available on a 24-hour time-scale with a 30-day trend line for the following parameters:
- CPU
- RAM
- Network Input
- Network Output
- Disk Read Bytes
- Disk Write Bytes
- Disk Read IOPS
- Disk Write IOPS
Utilisation (Historical)
To view historical usage across supported parameters, perform these steps:
- Navigate to Compute > Linux Instances.
- Select a Linux Instance and access the Utilisation tab. The following screen appears:
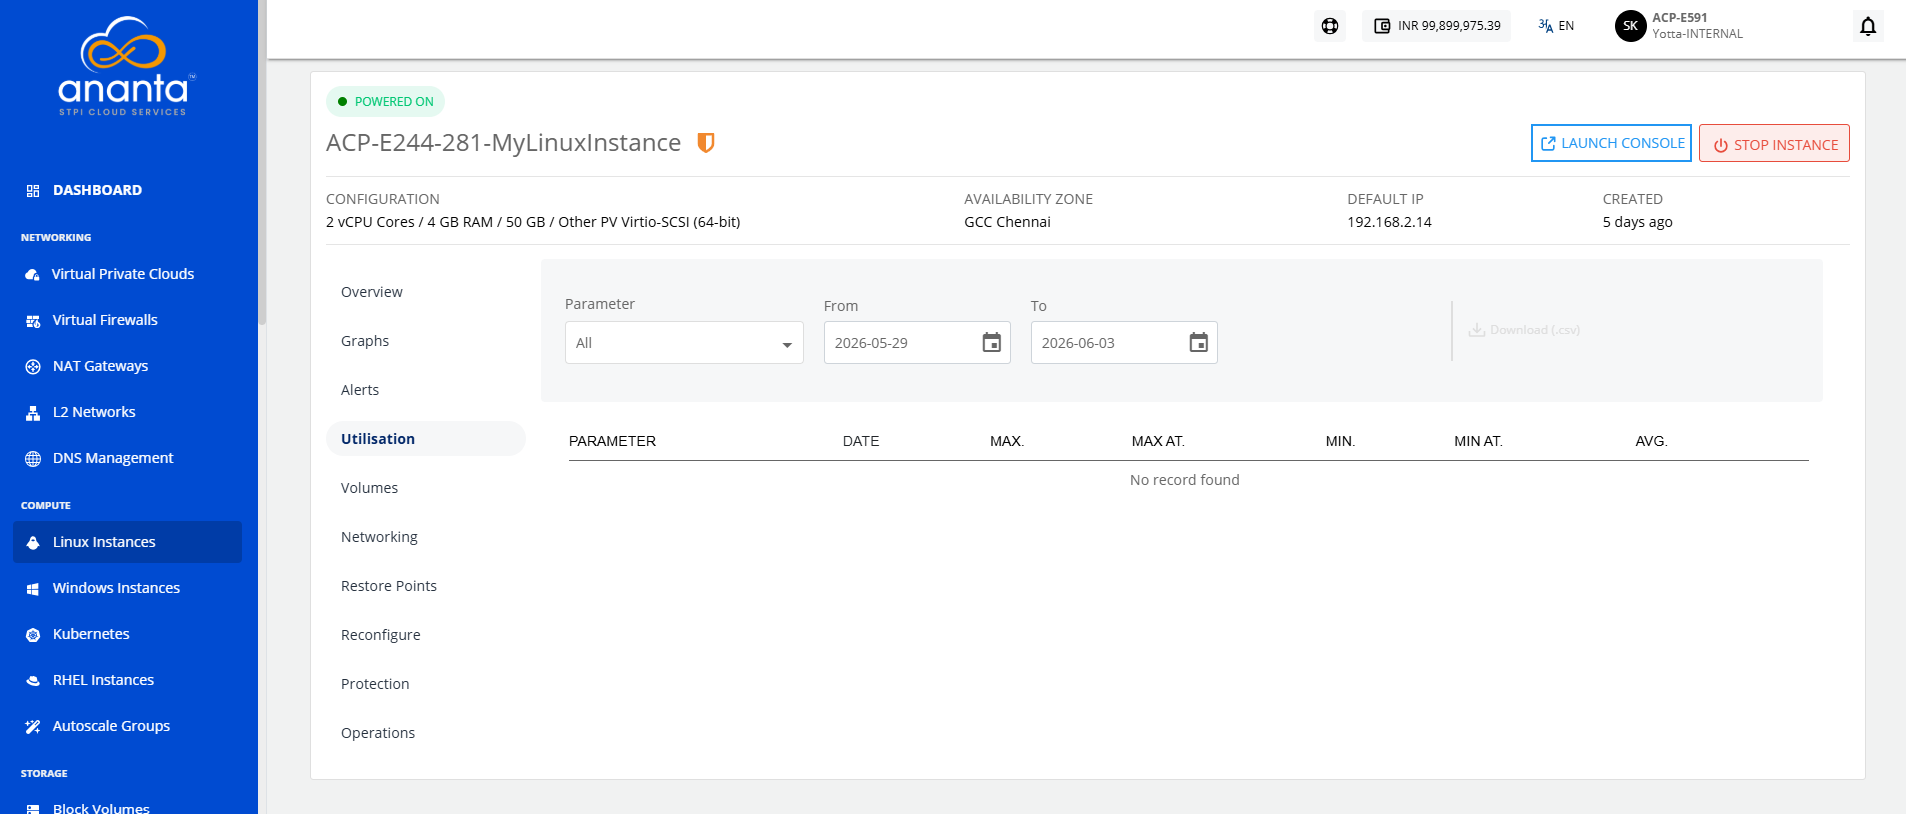
The Utilisation table shows historical date-wise details of daily maximum, minimum, and average readings for all parameters. The Utilisation report is downloadable as a .csv file.
The logs are available for a maximum period of two years.